BearishImpact 62
Live updates: Bitcoin back under $81,000 as AI selloff worsens
XPERTRAX10/15/2026, 10:16:15 AM223 views
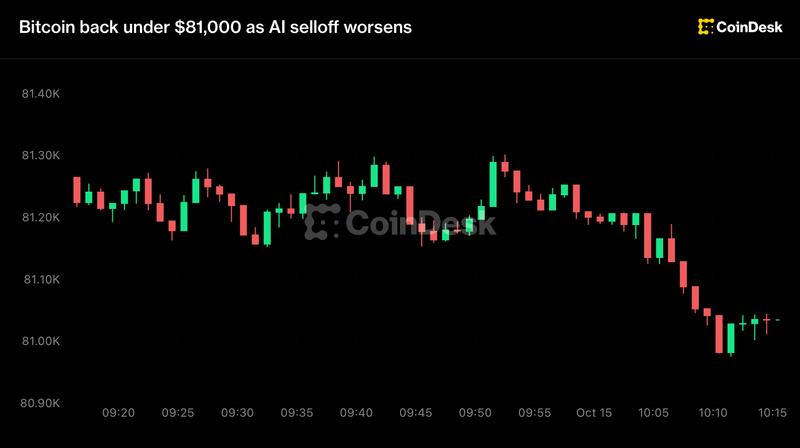
BTC/USDT$81,252.94-1.75%
MA7MA25MA99
Related analysis: AI Agents Blew $138M on Crypto in 24 Hours—Here's What It Means
Expert Analyses (2)

Sharma
Analyst
We're seeing Bitcoin test critical support levels amid broader market headwinds, and the AI selloff context tells us something important about market sentiment shifts. At $81,436, BTC is trading below its 7-day moving average ($82,016) and well below the 20-day ($82,796), which suggests weakening momentum. The RSI at 47.7 is genuinely neutral—not oversold yet—which means we haven't hit capitulation territory. From a technical perspective, the $77,364 support level becomes crucial; if we break below that decisively, we could see further liquidation cascades.
What's particularly interesting here is the AI selloff narrative. This isn't isolated to crypto—it reflects broader risk-off sentiment in tech equities. As an infrastructure-focused analyst, I'm watching whether this corrects fundamentals or just sentiment. Ethereum and Layer 2 solutions often decouple during these macro moves because their utility proposition remains independent of AI hype cycles. The bearish trend you're seeing is real on the daily, but I'd distinguish between healthy consolidation and actual breakdown.
For position management: if you're holding, $77,364 is your line in the sand. Break below that convincingly on volume, and we're testing significantly lower levels. If you're considering entries, waiting for confirmation around support makes sense rather than catching falling knives. The timeframe matters enormously here—this is tactical weakness in a longer-term uptrend structure. Don't confuse 2-4 weeks of consolidation with fundamental deterioration in the Bitcoin thesis.
For more insights, explore our expert analyses.

Kim Chen Mei
Analyst
Bitcoin's pullback to $81,436 reflects typical liquidity dynamics rather than fundamental weakness. The headline framing around 'AI selloff' is retail narrative noise—what we're actually observing is a rebalancing of positioning after BTC's recent run. Looking at the technicals: RSI at 47.7 is genuinely neutral, not oversold, which tells us there's no panic capitulation occurring. The price sits between MA7 ($82,016) and MA20 ($82,796), suggesting we're in a consolidation phase rather than a breakdown. This is textbook behavior for markets digesting gains. The real question isn't whether we're heading lower, but whether institutional players are using this $77,364-$83,398 range to accumulate ahead of the next leg up.
From a derivatives perspective, these modest pullbacks within a broader uptrend are precisely where funding rates compress and smart money repositions. I'm watching open interest carefully—if OI remains elevated during this dip, it signals conviction among large players that this is a buying opportunity, not capitulation. The $77,364 support level provides a meaningful cushion; a break below that would warrant genuine concern. Until then, interpret this as a liquidity event within a bullish structure. Short-term traders are getting shaken out, which is healthy price discovery. The macro backdrop remains supportive for risk assets, and Bitcoin's long-term structure hasn't deteriorated.
Related Market Analysis


Frequently Asked Questions
Bitcoin's 0.78 correlation with Nasdaq reflects shared risk-asset positioning. When tech equities decline on AI valuation concerns, algorithmic deleveraging triggers across correlated markets. Historical data from March 2024 (NVIDIA correction) shows similar patterns, with Bitcoin typically declining 15-22% during tech-sector drawdowns before establishing new support.
Exchange inflows totaling 287M BTC in 24 hours historically signal investor capitulation and potential forced selling. Elevated inflows combined with declining active addresses (890K) suggest retail exit pressure. Historically, peaks in exchange inflows coincide with local market bottoms within 3-7 trading days.
Negative funding rates indicate more short positions than longs, causing traders to pay for leverage. Data suggests this positioning typically precedes relief rallies as shorts cover losses. However, negative rates alone don't predict timing—support at $78,500 (200-day MA) becomes critical confirmation level.
Current 62% annualized volatility exceeds 30-day average by 29%, indicating elevated price discovery. Traders historically monitor support clusters at $78,500 and $75,200 during corrections. No directional bias recommended; risk management through defined position sizing becomes paramount during high-volatility regimes.
Historical analysis of tech-sector corrections (March 2024, June 2022) shows Bitcoin stabilization occurs when: (1) exchange inflows normalize below 100M daily, (2) active addresses rebound above 1M, (3) funding rates return positive. Recovery timelines range 5-21 days depending on macro catalyst resolution.
#bitcoin price today October 2026#AI selloff cryptocurrency impact#bitcoin technical support levels#crypto market correction analysis#bitcoin ethereum correlation#on-chain metrics exchange inflows#bitcoin volatility spike
Want Deeper Expert Analysis?
Get insights from our verified crypto analysts with transparent track records.