EMA vs SMA Crypto: Which Moving Average Is Better for Trading?
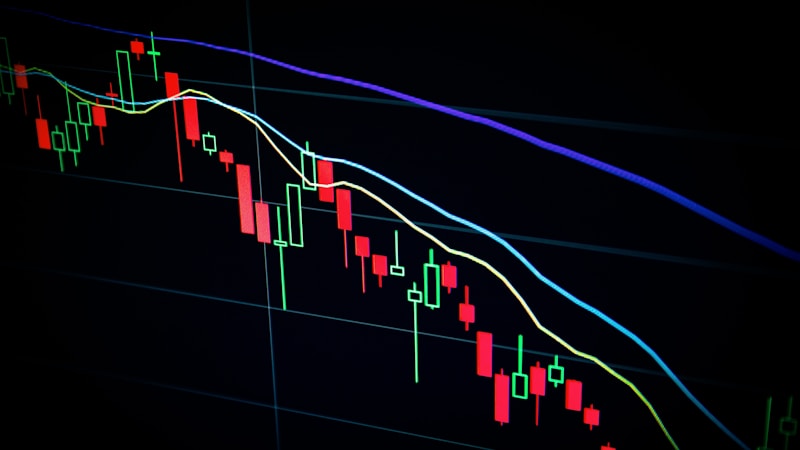
EMA vs SMA crypto traders debate which moving average produces better signals. Both the Exponential Moving Average and Simple Moving Average smooth price data to reveal trends, but they calculate averages differently—leading to distinct trading characteristics. In this guide, you will learn how each works, when to use them, and how to combine them for more effective analysis.
Quick Definition
Moving averages calculate the average price over a specified period to filter noise and identify trend direction. The Simple Moving Average (SMA) weights all prices equally. The Exponential Moving Average (EMA) weights recent prices more heavily, making it faster to react to new information. Neither is universally better—each suits different trading situations.
How Moving Averages Work
Simple Moving Average (SMA)
SMA adds closing prices over a period and divides by the number of periods:
10-day SMA = (P1 + P2 + ... + P10) / 10
Each price point has equal weight. This creates a smoother line that lags price more but filters out more noise.
Exponential Moving Average (EMA)
EMA applies a multiplier that gives more weight to recent prices:
EMA = (Current Price × Multiplier) + (Previous EMA × (1 - Multiplier))
This creates a line that reacts faster to price changes but may produce more false signals in choppy markets.
EMA vs SMA Comparison
| Factor | SMA | EMA |
|---|---|---|
| Responsiveness | Slower | Faster |
| Price Weighting | Equal for all periods | Heavier on recent prices |
| Lag | More lag | Less lag |
| False Signals | Fewer | More |
| Trend Identification | Better for long-term | Better for short-term |
| Noise Filtering | More smoothing | Less smoothing |
How Traders Use Moving Averages in Crypto
Trend Identification
The most basic use: price above the MA suggests uptrend; price below suggests downtrend. Longer-period MAs (50, 100, 200) identify major trends; shorter periods (9, 20) show immediate momentum.
Dynamic Support and Resistance
Moving averages often act as support in uptrends and resistance in downtrends. The 50-day and 200-day SMAs are particularly watched by institutional traders, making them self-fulfilling levels. Learn more about levels in our support and resistance guide.
Crossover Signals
- Golden Cross: 50-period MA crosses above 200-period MA—bullish signal
- Death Cross: 50-period MA crosses below 200-period MA—bearish signal
- Short-term crossovers: 9 EMA crossing 21 EMA provides faster signals for active traders
Multiple Moving Average Systems
Many traders use several MAs together:
- 20/50/200: Short, medium, and long-term trend stack
- 9/21 EMA: Fast system for momentum trading
- EMA ribbon: Multiple EMAs (8, 13, 21, 34, 55) showing trend strength
When to Use SMA vs EMA
Use SMA When:
- Identifying major, long-term trends (50, 100, 200 SMA)
- Trading slower timeframes (daily, weekly)
- Wanting fewer signals with higher reliability
- Analyzing institutional-watched levels (200 SMA is widely tracked)
- Reducing noise in choppy market conditions
Use EMA When:
- Day trading or scalping where speed matters
- Trading in strongly trending markets
- Wanting earlier entry signals (accepting more false signals)
- Using as component in other indicators (MACD uses EMAs)
- Analyzing fast-moving crypto assets
Step-by-Step: Moving Average Workflow
- Determine your timeframe: Match MA periods to your trading style—shorter for day trading, longer for swing/position trading.
- Add trend MA: Apply 50 and 200 SMA to identify major trend direction.
- Add signal MA: Apply 9 and 21 EMA for entry timing signals.
- Assess trend alignment: Strongest trades occur when short, medium, and long MAs align in the same direction.
- Wait for pullbacks: In uptrends, look for price to pull back to the 20 or 50 MA before entering.
- Confirm with other tools: Use RSI or MACD to confirm momentum at MA levels.
- Set stops: Place stops beyond the MA being used for support/resistance.
Common Mistakes
- Too many MAs: Using 5+ moving averages creates confusion. Stick to 2-3 with clear purposes.
- Wrong period for timeframe: A 200 SMA on a 5-minute chart behaves differently than on a daily chart.
- Treating MAs as exact levels: MAs are zones, not precise prices. Allow for some deviation.
- Ignoring the trend: MA crossovers in sideways markets generate many false signals.
- Switching constantly: Pick a system and stick with it long enough to evaluate properly.
Risk Notes
- Lagging indicators: All moving averages lag price. They confirm trends, not predict them.
- Whipsaw in ranges: Sideways markets produce many false crossover signals. Add filters or avoid trading ranges.
- Crypto volatility: Standard MA settings may need adjustment for highly volatile altcoins.
- Position sizing: Even reliable MA signals fail. Risk only 1-2% per trade.
Popular Moving Average Settings
| Period | Type | Common Use |
|---|---|---|
| 9 | EMA | Short-term momentum, scalping |
| 20/21 | EMA or SMA | Short-term trend, swing trading |
| 50 | SMA or EMA | Medium-term trend, institutional level |
| 100 | SMA | Intermediate trend |
| 200 | SMA | Long-term trend, major support/resistance |
How Moving Averages Connect to Technical Analysis
Moving averages form the foundation of crypto technical analysis. They appear in other indicators like MACD and Bollinger Bands, serve as dynamic support/resistance levels, and provide the simplest method for trend identification. Mastering MAs is essential before advancing to more complex analysis techniques.
FAQs
Which is better for crypto, EMA or SMA?
Neither is universally better. Use EMA for faster signals in short-term trading; use SMA for smoother trend identification in longer-term analysis. Many traders use both—EMA for entries, SMA for trend context.
What is the best moving average period for crypto?
The 20, 50, and 200 periods are most widely used. The 200 SMA is particularly important as institutional traders watch it. For crypto day trading, the 9 and 21 EMAs are popular for faster signals.
Do professional traders use moving averages?
Yes. Moving averages remain foundational tools for professional traders. The 50 and 200 SMAs are watched globally, and many algorithmic systems incorporate MA-based signals.
How many moving averages should I use?
Two to three is optimal: one for long-term trend (200), one for medium-term (50), and one for short-term signals (20 or 21). More than three often creates conflicting information.
Summary
- SMA weights all prices equally for smoother, slower signals; EMA weights recent prices for faster response.
- Use SMA for long-term trend identification and institutional levels; use EMA for short-term trading and faster entries.
- Moving average crossovers (Golden Cross, Death Cross) signal potential trend changes but require confirmation.
- MAs work as dynamic support and resistance, especially the 50 and 200 periods.
- Combine moving averages with momentum indicators and volume for higher-probability trading setups.
Continue Learning
Build on your moving average knowledge with these related guides: