NeutralImpact 58
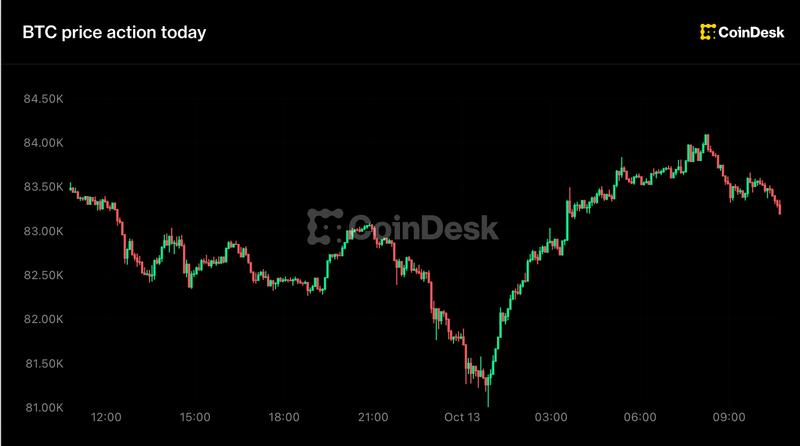
Live updates: Bitcoin whipsaws between $81,000 and $84,000 as altcoins slide
XPERTRAX10/13/2026, 10:46:57 AM225 views
AI Market Impact Summary
SentimentNeutral
Impact Score58/100
Affected AssetsBTC, ETH, SOL
BTC/USDT$81,719.4-2.00%
MA7MA25MA99
For deeper insight into whale accumulation patterns and institutional positioning, explore our related market analysis.
Related Market Analysis

Hex and PulseChain founder Richard Heart detained in Istanbul: reports
HEXPLS

Crypto Long & Short: Why gold and bitcoin belong in the same portfolio
BTCETH

Bitcoin Falls as Hot Inflation Puts a Fed Hike Back on the Table
BTCETH

EasyA hits $1.1 billion valuation, targets 2027 public listing and tokenized shares
ETHBTC
Related Questions
Frequently Asked Questions
Consolidation indicates equilibrium between buyers and sellers within a defined range. Historically, such patterns resolve within 48–72 hours with either a breakout above resistance or breakdown below support. Current funding rates (neutral) and whale accumulation suggest limited directional bias, making technical levels critical for traders.
Altcoins typically exhibit higher volatility and follow Bitcoin weakness with amplified moves. Current Ethereum (-2.8%) and Solana (-4.1%) declines suggest rotation toward Bitcoin or risk-off sentiment. This pattern historically precedes BTC volatility expansion. Traders monitor altcoin weakness as an early warning signal.
Whale addresses accumulating 12,400 BTC over 48 hours signals institutional or high-conviction retail confidence at current levels. However, rising exchange inflows (8.3% increase) indicate simultaneous selling pressure. Data suggests mixed sentiment—accumulation at support but preparation for potential exits near resistance.
Neutral funding rates (0.04–0.06%) indicate balanced long/short positioning, meaning neither bulls nor bears dominate. Rising rates typically precede rallies; negative rates suggest shorting pressure. Current neutral levels reflect indecision, common before consolidation breakouts. Traders monitor rate shifts for directional hints.
Technical analysis identifies $84,200 (200-day moving average) as near-term resistance and $80,800 (50-day MA) as support. Historically, breakouts above resistance target $86,500; breakdown below support may test $78,900. Volume decline (12% below average) suggests conviction is lacking for immediate moves.
#bitcoin price today 2026#BTC USD consolidation#altcoin decline ethereum solana#bitcoin technical analysis support resistance#on-chain whale activity#crypto market volatility october 2026#bitcoin funding rates#ethereum btc correlation
Want Deeper Expert Analysis?
Get insights from our verified crypto analysts with transparent track records.